Measure/Column dependencies in Power BI
Last week I had to change the source of a data model and this one was especially intricate, with a bunch of views not being available anymore, tables/columns changing names, and data outright not existing anymore. When coping with changes to your underlying data it becomes near-impossible to manually keep track of which measures are referencing which columns, directly or indirectly…
Wouldn’t it be nice if we could just point at a column and know about any measure that would crash if we messed with it? Yes, it would—it would be a godsend! And we can do exactly that.
Here are the 4 simple steps to analyze hierarchies of dependency.
𝗣𝗿𝗲𝗿𝗲𝗾𝘂𝗶𝘀𝗶𝘁𝗲 - 𝗜𝗻𝘀𝘁𝗮𝗹𝗹 𝗧𝗮𝗯𝘂𝗹𝗮𝗿 𝗘𝗱𝗶𝘁𝗼r
Did you know that Power BI has a bunch of capabilities not available in its UI? Well, it does, and by using external tools we can utilize them—Tabular Editor is one of them. For those who aren’t familiar with it, Tabular Editor is, in my opinion, a must-have free open-source tool for anyone working with Power BI data modeling.
But it does more than unlock pre-existing capabilities, it also has its own range of features, and one of them is… You guessed it, dependency mapping!
So start by installing Tabular Editor, and if you’re unsure how to, just google it. It’s a 5-minute task and you will thank yourself later.
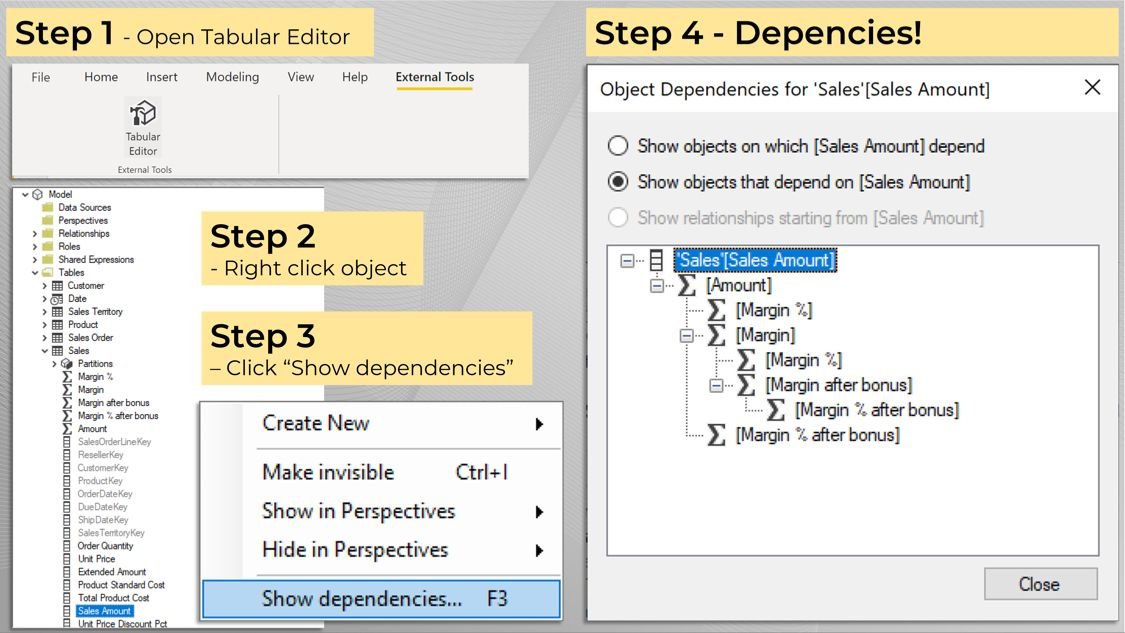
𝟭) 𝗢𝗽𝗲𝗻 𝗧𝗮𝗯𝘂𝗹𝗮𝗿 𝗘𝗱𝗶𝘁𝗼𝗿
First, open your Power BI dataset, then go to external tools and open Tabular Editor from there.
This way Tabular Editor opens with a pre-configured connection to your dataset.
𝟮) 𝗙𝗶𝗻𝗱 𝘆𝗼𝘂𝗿 𝗼𝗯𝗷𝗲𝗰𝘁-𝗶𝗻-𝘀𝗰𝗼𝗽𝗲, 𝗿𝗶𝗴𝗵𝘁-𝗰𝗹𝗶𝗰𝗸 𝗶𝘁
Once you’ve opened Tabular Editor you can simply browse your tables, find the column or measure you want to analyze, and right-click it.
This is also the step where you may skip ahead and just click “F3” if you desire.
𝟯) 𝗖𝗵𝗼𝗼𝘀𝗲 “𝗦𝗵𝗼𝘄 𝗱𝗲𝗽𝗲𝗻𝗱𝗲𝗻𝗰𝗶𝗲𝘀...”
Finally simply click show dependencies and done! That's it.
𝟰) 𝗗𝗲𝗽𝗲𝗻𝗱𝗲𝗻𝗰𝗶𝗲𝘀!
You now have a full hierarchy of dependencies—Initially which other objects depend on the object-in-scope, but click the button and instead, you see what other object it relies on itself.
Incredibly powerful, and time-saving not having to go through all those measures and columns manually.
It easily saved me a few hours this week.